Logistic Regression
Logistic Regression
Logistic Regression is a supervised machine learning algorithm used for classification problems, where the output belongs to one of two or more categories.
Unlike Linear Regression, which predicts continuous numerical values, Logistic Regression predicts the probability that an observation belongs to a particular class and then converts that probability into a class label.
Example
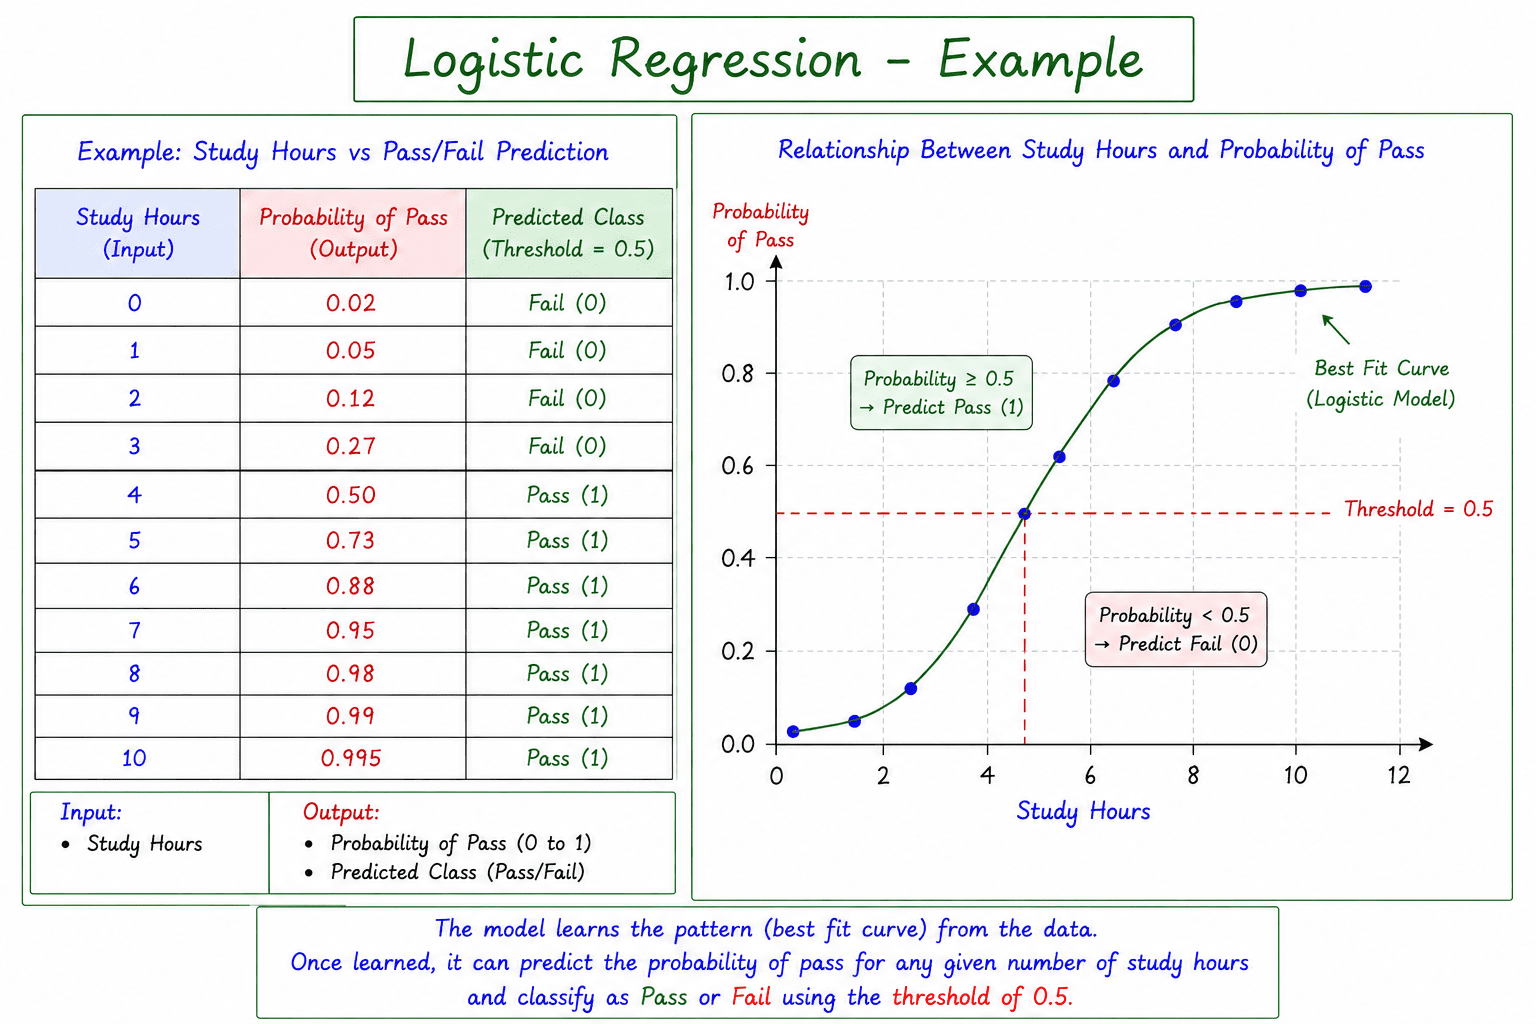
The figure illustrates the relationship between Study Hours and the Probability of Passing.
Input (X) → Output (Y)
Independent Variable (X) -> Dependent Variable (Y)
Study Hours → Probability of Pass
The table on the left contains historical data showing the number of study hours, the predicted probability of passing, and the corresponding class (Pass or Fail).
The graph on the right plots these probabilities against study hours and displays the Sigmoid Curve, which represents the relationship learned by the Logistic Regression model.
Logistic Regression Equation
The Sigmoid Function, also known as the Logistic Function, is the core of Logistic Regression. It converts any real-valued input into a probability between 0 and 1.
The Logistic Regression model predicts probability using the Sigmoid Function:
\[P(Y=1)=\frac{1}{1+e^{-z}}\]
where
\[z=b0+b1x1+b2x2+⋯+bnxn\]
Meaning of Terms
| Symbol | Meaning |
|---|---|
| P(Y=1) | Probability of belonging to Class 1 |
| xi | Input Feature |
| b0 | Intercept |
| bi | Coefficient of Feature |
| z | Linear Combination of Features |
Understanding the Sigmoid Function
The Sigmoid Function converts any input value into a probability between 0 and 1.
As the value of z increases, the probability moves closer to 1. As z decreases, the probability approaches 0.
This makes Logistic Regression suitable for classification problems where the output represents probabilities.
Understanding the Graph
The graph in the figure shows:
- Study Hours on the X-axis.
- Probability of Passing on the Y-axis.
- Blue points representing the predicted probabilities.
- A Sigmoid Curve representing the learned relationship.
- A threshold of 0.5, which divides the predictions into two classes.
The curve shows that as study hours increase, the probability of passing also increases.
Decision Boundary
After predicting the probability, Logistic Regression compares it with a threshold value (usually 0.5).
- Probability ≥ 0.5 → Pass (Class 1)
- Probability < 0.5 → Fail (Class 0)
This threshold is known as the Decision Boundary, as it separates one class from the other.
Types of Logistic Regression
| Type | Description | Example |
|---|---|---|
| Binary Logistic Regression | Predicts one of two classes | Pass / Fail |
| Multinomial Logistic Regression | Predicts one of three or more classes | Cat / Dog / Bird |
| Ordinal Logistic Regression | Predicts ordered classes | Poor / Average / Good / Excellent |
Best Decision Boundary
Unlike Linear Regression, which learns a Best-Fit Line, Logistic Regression learns a Decision Boundary that separates different classes.
The objective is to estimate the probability of each class and determine the boundary that best distinguishes one class from another.
Classification Error
After classification, the predicted class is compared with the actual class.
Fewer classification errors indicate a better-performing mode
| Actual Class | Predicted Class | Result |
|---|---|---|
| Pass | Pass | Correct |
| Fail | Pass | Incorrect |
How is the Decision Boundary Found?
The objective of Logistic Regression is to learn the best decision boundary that separates different classes.
Several optimization techniques can be used to determine the optimal model parameters, including:
- Gradient Descent
- Stochastic Gradient Descent (SGD)
- Mini-Batch Gradient Descent
Unlike Linear Regression, which minimizes the Mean Squared Error (MSE), Logistic Regression minimizes the Log Loss (Cross-Entropy Loss).
Applications of Logistic Regression
Email Spam Detection
Predicts whether an email is spam or not spam.
Disease Diagnosis
Predicts whether a patient is likely to have a disease based on medical data.
Loan Approval
Predicts whether a loan application should be approved or rejected.
Customer Churn Prediction
Predicts whether a customer is likely to leave a company or continue using its services.
Fraud Detection
Predicts whether a transaction is fraudulent or legitimate.
Sentiment Analysis
Predicts whether a review or message expresses a positive, negative, or neutral sentiment.