Introduction to Supervised ML
Supervised Machine Learning is a type of Machine Learning in which a model learns from labeled data. In labeled data, both the input and the correct output are already known.
The model studies these examples and learns the relationship between the inputs and outputs. Once trained, it can use this knowledge to make predictions on new, unseen data.
Supervised learning uses known data as examples to learn patterns and make accurate predictions on future data.
Supervised learning is a powerful technique that learns from labeled examples and is widely used in areas such as healthcare, banking, education, e-commerce, and social media to make predictions and support decision-making.
It is called supervised because the model learns with guidance, similar to how a student learns from a teacher who provides both questions and correct answers.
Example
A teacher gives the following examples:
- 2 + 3 = 5
- 4 + 2 = 6
- 5 + 1 = 6
After observing these examples, the student understands the pattern and can answer:
- 3 + 4 = 7
In the same way, a supervised learning model learns from input-output pairs and then predicts outputs for new inputs.
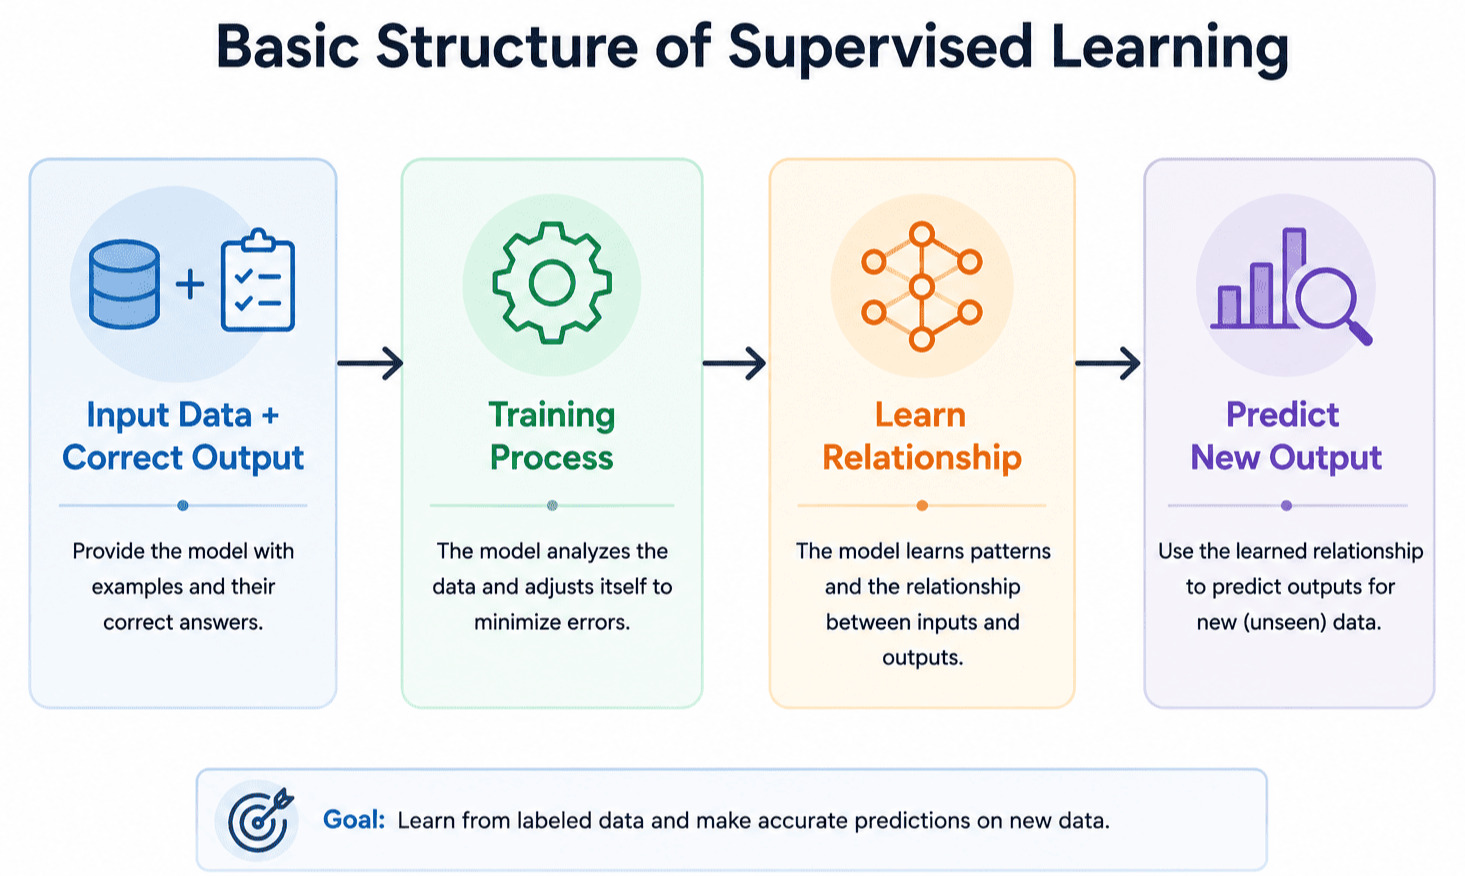
Basic Structure of Supervised Learning
Real-World Example
Student Marks Prediction
| Study Hours | Marks |
|---|---|
| 2 | 35 |
| 4 | 55 |
| 6 | 70 |
| 8 | 90 |
In this example:
- Study Hours represent the input feature (X).
- Marks represent the output variable (Y).
The model learns how study hours influence marks.
After training, if a new student studies for 5 hours, the model can estimate the expected marks as approximately 62.
This is a simple example of how supervised learning uses past data to predict future outcomes.
Important Components of Supervised Learning
A supervised learning system consists of several key components that help the model learn patterns and make predictions.
1. Input Variables (Features)
Input variables, also called features, are the pieces of information used by the model to make predictions. They describe the characteristics of the data.
Examples:
- Study Hours
- House Area
- Age
- Salary
- Temperature
For instance, if we want to predict a student's marks, the number of study hours can be used as a feature.
2. Output Variable (Target)
The output variable, also known as the target or label, is the value that the model is trying to predict.
Examples:
- Marks
- House Price
- Disease Status
- Spam / Not Spam
In a marks prediction problem, the marks obtained by students would be the target variable.
3. Training Dataset
The training dataset is the data used to teach the model.
It contains:
- Input variables (features)
- Corresponding correct outputs (targets)
By analyzing this data, the model learns the relationship between inputs and outputs.
Example:
| Study Hours | Marks |
|---|---|
| 2 | 35 |
| 4 | 55 |
| 6 | 70 |
The model uses these examples to learn how study hours affect marks.
4. Testing Dataset
The testing dataset is used after training to evaluate how well the model performs on data it has never seen before.
This helps us determine whether the model can make reliable predictions in real-world situations.
Common Data Splits
| Training Data | Testing Data |
|---|---|
| 80% | 20% |
| 70% | 30% |
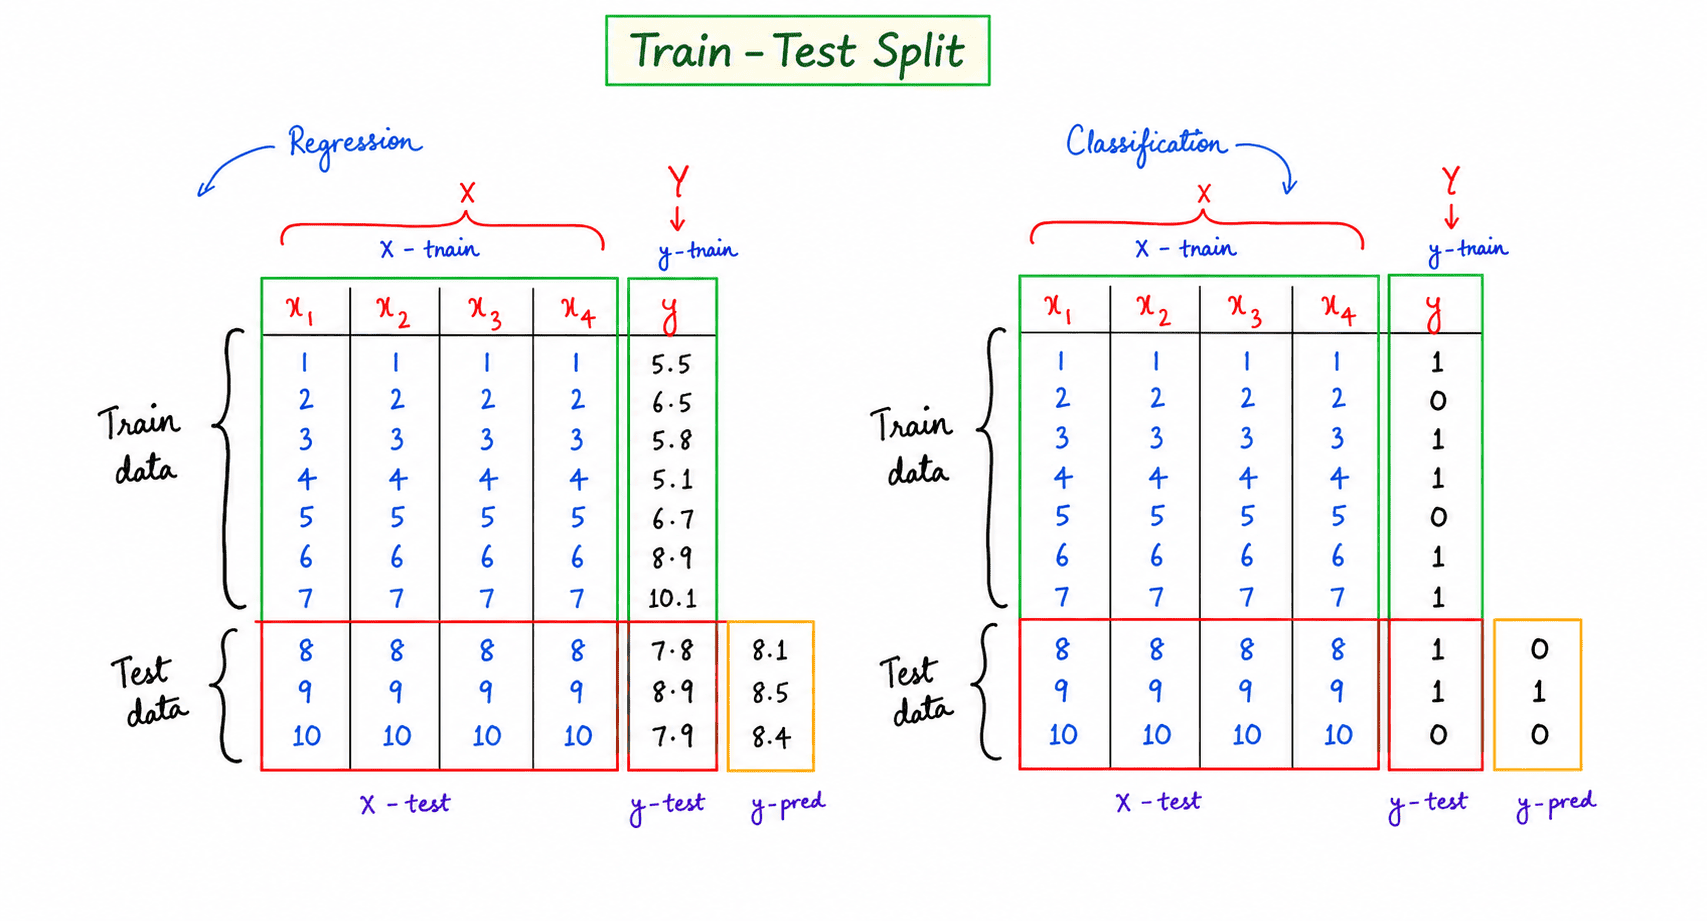
Train Test Split
A larger training set helps the model learn better, while the testing set provides an unbiased evaluation of its performance.
Working of Supervised Learning
Supervised learning follows a step-by-step process in which a model learns from examples and then uses that knowledge to make predictions.
Step 1: Collect Labeled Data
The process begins by collecting a dataset that contains both the input values and the correct outputs. Since the answers are already known, the model can learn the relationship between them.
Example:
| Age | Salary | Purchased Product |
|---|---|---|
| 22 | 25000 | Yes |
| 35 | 50000 | No |
| 28 | 32000 | Yes |
In this dataset, Age and Salary are the inputs, while Purchased Product is the output.
Step 2: Preprocess the Data
The collected data is usually cleaned before it is used for training. Missing values, duplicate records, and inconsistencies are handled so that the model receives better-quality data. Categorical values may also be converted into numerical form.
Step 3: Split the Dataset
The dataset is divided into two parts. One part is used for training the model, while the other part is reserved for testing its performance. A common practice is to use 80% of the data for training and 20% for testing.
Step 4: Select an Algorithm
An appropriate algorithm is chosen depending on the problem being solved. Algorithms such as Linear Regression, Logistic Regression, Decision Trees, Random Forests, and SVM are commonly used in supervised learning.
Step 5: Train the Model
During training, the model studies the examples in the training dataset and learns the pattern that connects the inputs to the outputs. The more relevant examples it sees, the better it can understand the relationship.
Step 6: Make Predictions
After training is complete, the model can be given new data that it has never seen before. Based on what it has learned, it predicts the most likely output.
For example, when details of a new customer are provided, the model can predict whether the customer is likely to purchase a product.
Step 7: Evaluate the Model
The final step is to evaluate the model. Its predictions are compared with the actual outcomes in the testing dataset. This helps determine how accurately the model performs on unseen data.
Types of Supervised Learning
Supervised learning is broadly divided into two main categories:
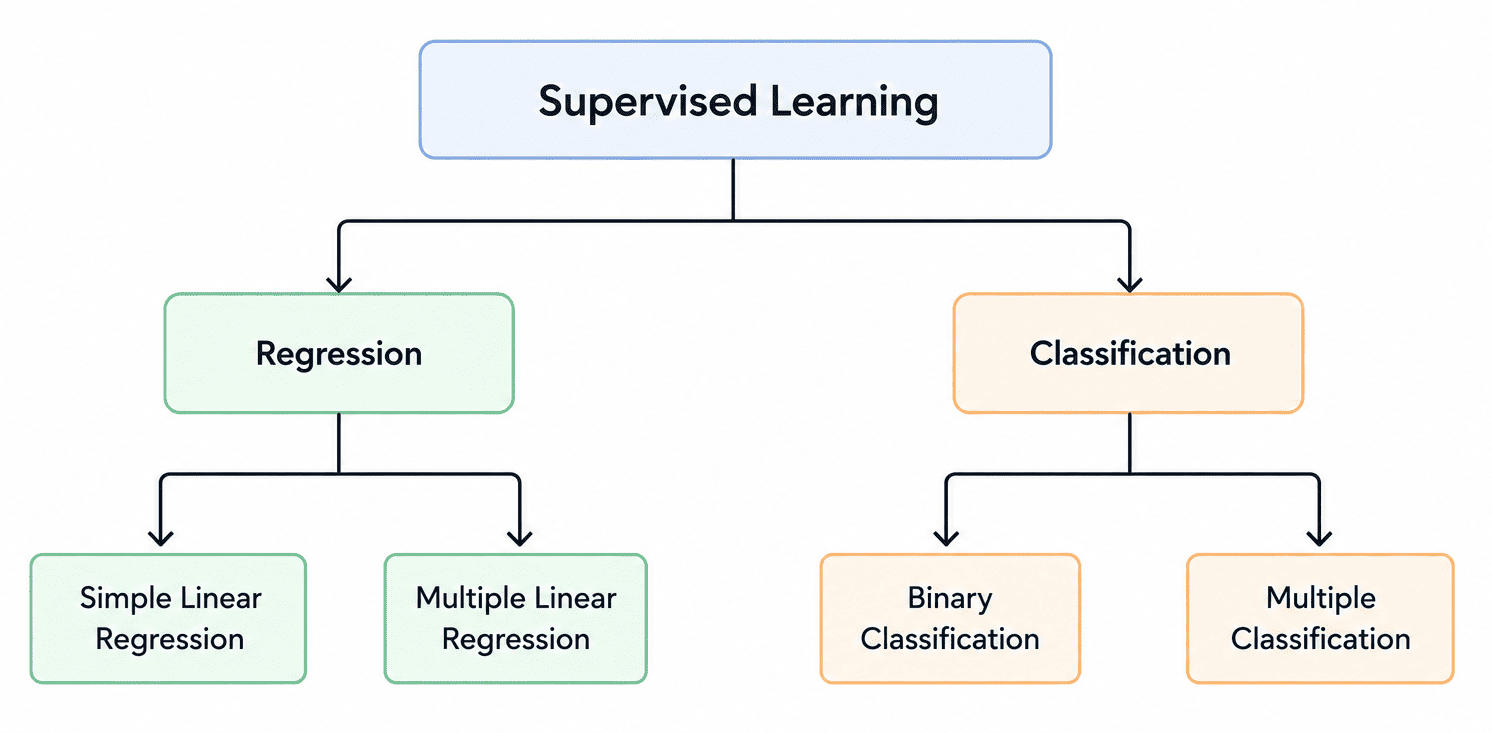
Taxonomy of Supervised Machine Learning
The choice between regression and classification depends on the type of output we want to predict.
1. Regression
Regression is used when the output is a numerical value. The goal is to predict a quantity that can take any value within a range.
Examples of Regression
- Predicting house prices
- Forecasting sales
- Estimating salaries
- Predicting temperature
- Predicting stock prices
Example:
A model can learn the relationship between the area of a house and its price.
House Area → House Price
If the area increases, the price generally increases as well.
Types of Regression
Simple Linear Regression
Simple Linear Regression uses one input variable to predict one output variable.
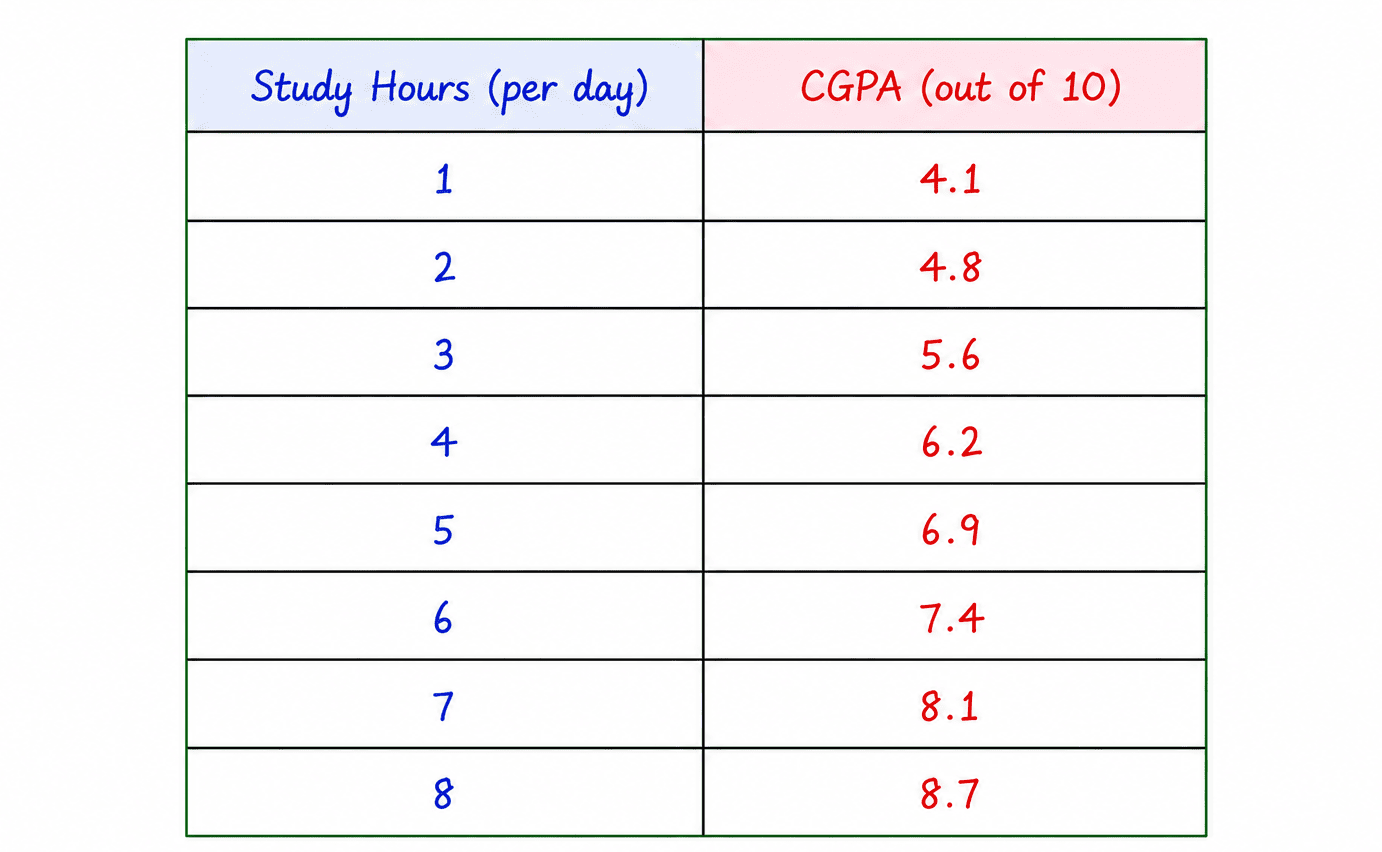
Simple Linear Regression Example
The model learns how marks change as study hours increase.
Multiple Linear Regression
Multiple Linear Regression uses two or more input variables to predict an output.
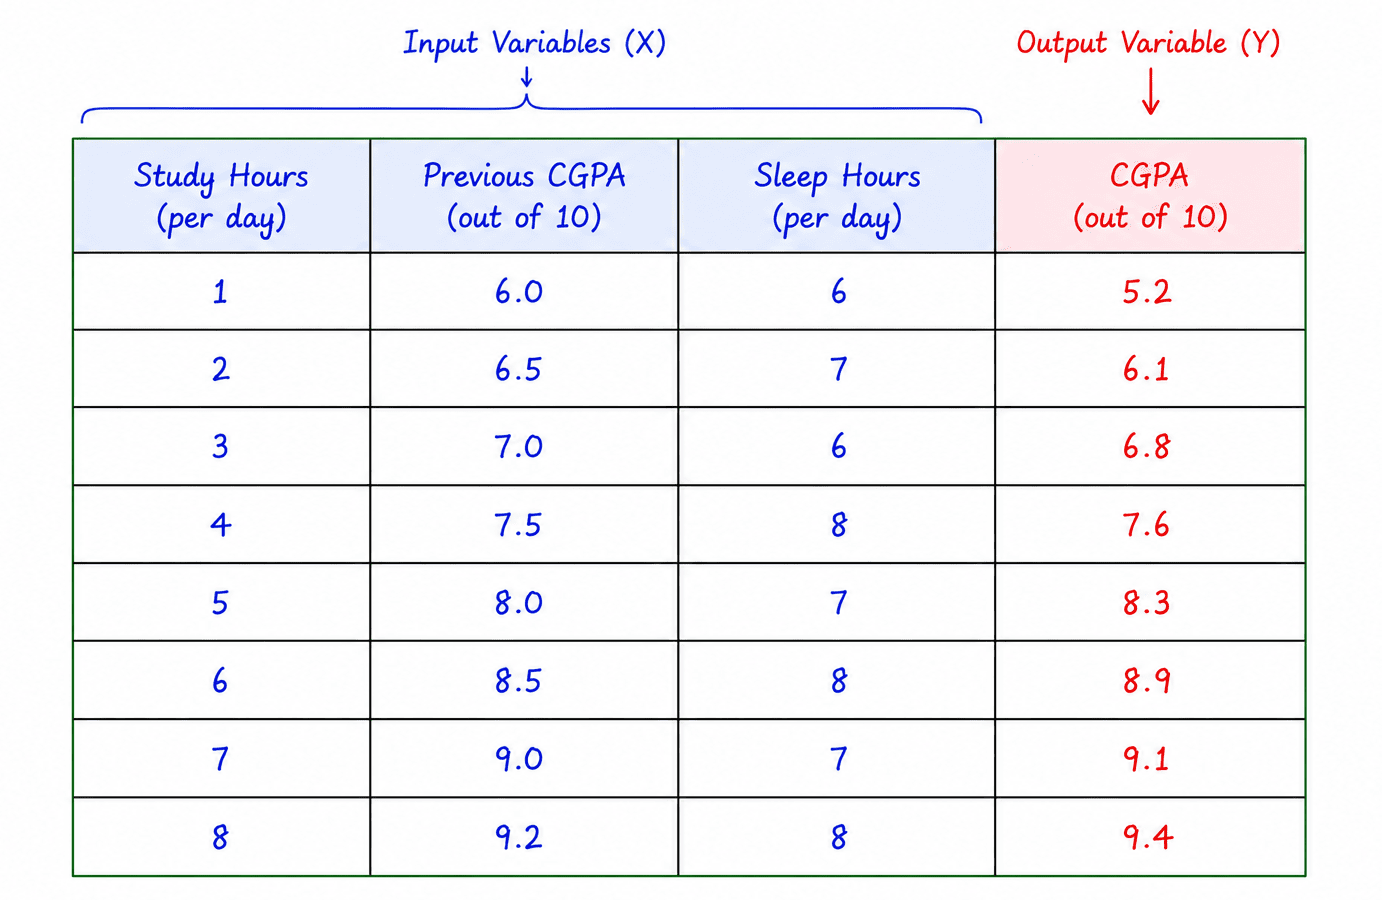
Multiple Linear Regression
Here, the prediction depends on multiple factors rather than a single feature.
Common Regression Algorithms
- Linear Regression
- Polynomial Regression
- Ridge Regression
- Lasso Regression
- Decision Tree Regression
2. Classification
Classification is used when the output belongs to a specific category or class. Instead of predicting a number, the model predicts a label.
Examples of Classification
- Spam detection
- Disease diagnosis
- Fraud detection
- Sentiment analysis
- Customer churn prediction
Example:
Email → Spam or Not Spam
The model examines the email and assigns it to the appropriate category.
Types of Classification
Binary Classification
Binary Classification involves only two possible classes.
Examples:
- Spam / Not Spam
- Pass / Fail
- Yes / No
- Fraud / Not Fraud
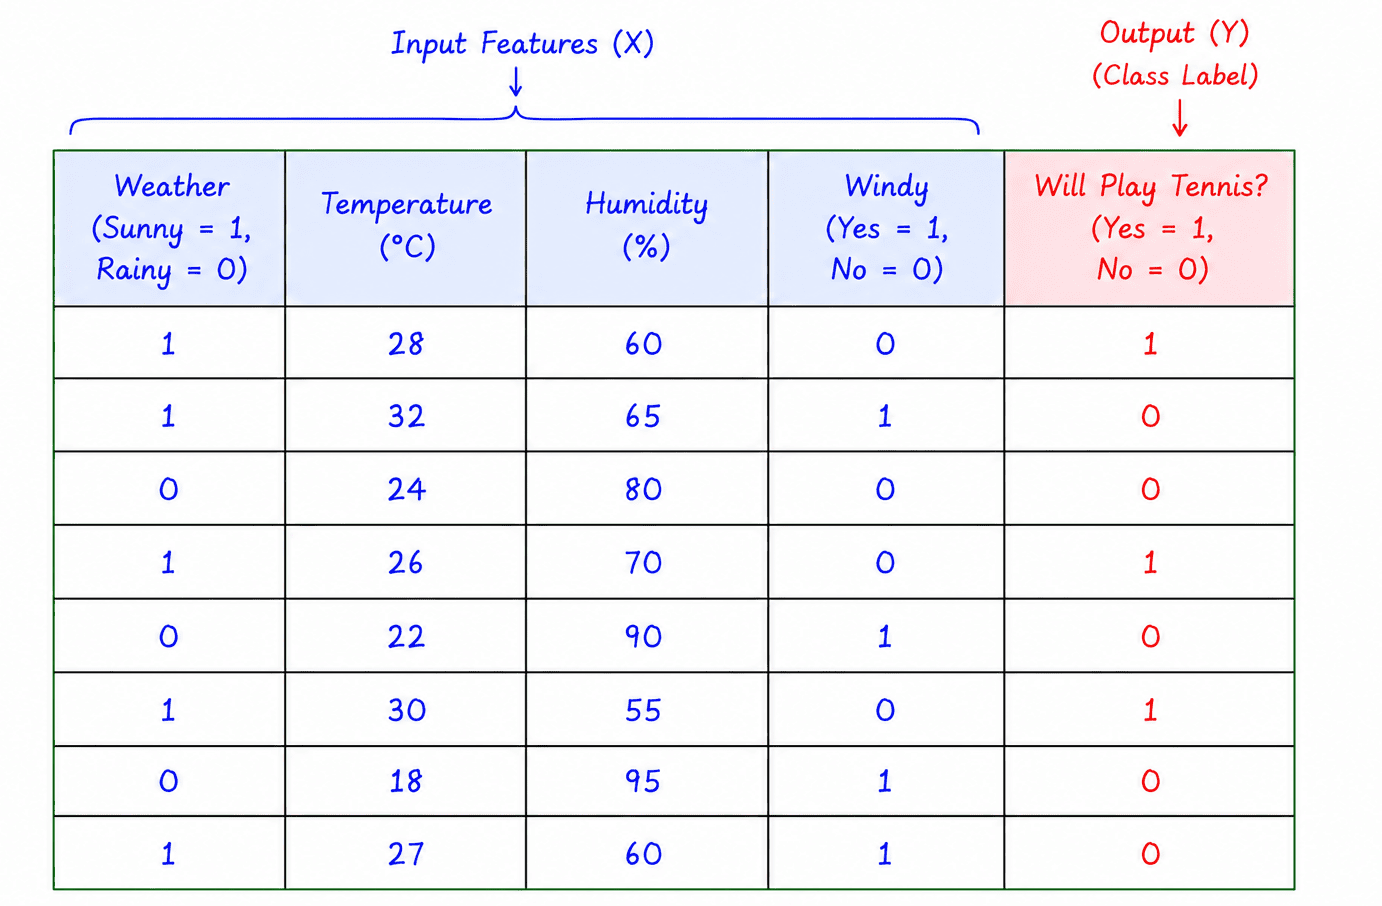
Example of Binary Classification
Since there are only two outcomes, the model chooses one of them.
Multiclass Classification
Multiclass Classification involves more than two classes.
Examples:
- Predicting grades: A, B, C, D
- Identifying animal species: Cat, Dog, Bird
- Handwritten digit recognition: 0–9
The model selects one class from several possible categories.
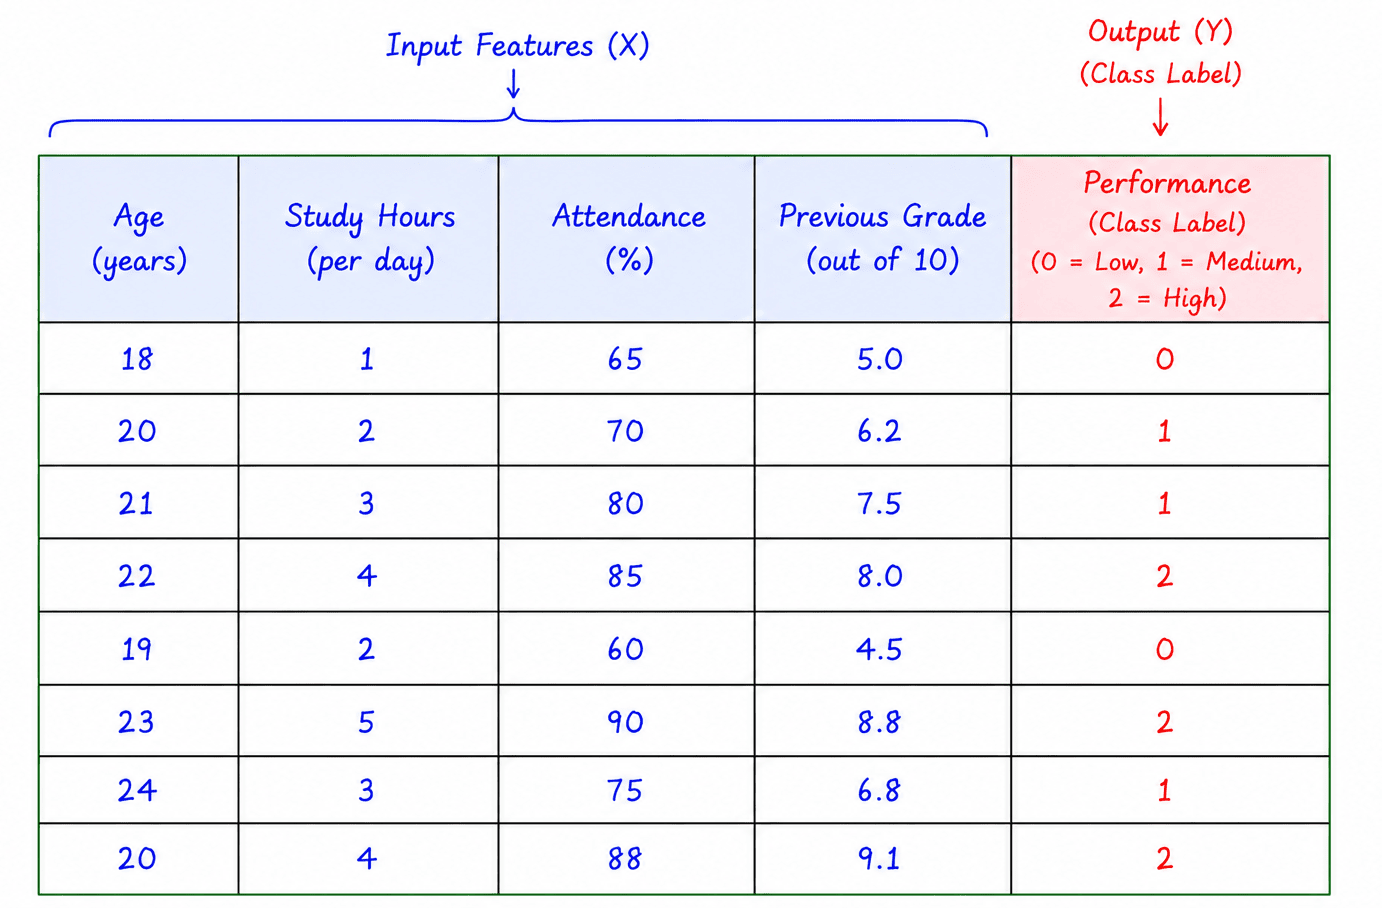
Example of Multiclass classification
Common Classification Algorithms
- Logistic Regression
- Decision Tree
- Random Forest
- Support Vector Machine (SVM)
- K-Nearest Neighbors (KNN)
- Neural Networks
Regression vs Classification
| Feature | Regression | Classification |
|---|---|---|
| Output Type | Numerical Value | Category/Class |
| Example | House Price Prediction | Spam Detection |
| Result | Continuous Value | Discrete Class |
| Goal | Predict a Quantity | Predict a Label |
Common Performance Metrics
Regression Metrics
Used for numerical predictions.
| Metric | Meaning |
|---|---|
| MSE | Mean Squared Error |
| RMSE | Root Mean Squared Error |
| MAE | Mean Absolute Error |
| R² Score | Accuracy of regression model |
Classification Metrics
Used for category prediction.
| Metric | Meaning |
|---|---|
| Accuracy | Correct predictions percentage |
| Precision | Correct positive predictions |
| Recall | Ability to find positives |
| F1 Score | Balance of Precision and Recall |
| ROC Curve | Classification performance graph |
| Confusion Matrix | Prediction comparison table |
Characteristics of Supervised Learning
Supervised learning has a few important features that make it one of the most widely used machine learning approaches.
- It learns from labeled data, where the correct output is already known.
- It identifies the relationship between inputs and outputs.
- It is mainly used for making predictions and classifications.
- The data is usually divided into training and testing sets.
- Its performance can be measured using different evaluation metrics.
Advantages of Supervised Learning
Supervised learning offers several benefits, especially when sufficient data is available.
- It often provides accurate predictions when trained on good-quality data.
- Model performance can be evaluated easily using test data.
- It is suitable for a wide range of real-world problems.
- The model learns from examples, making the learning process straightforward.
- Many supervised learning models are easy to understand and interpret.
Disadvantages of Supervised Learning
Despite its advantages, supervised learning also has some limitations.
- It requires labeled data, which may not always be available.
- Preparing and labeling data can be time-consuming and costly.
- Poor-quality data can lead to inaccurate predictions.
- Some problems require very large datasets for effective learning.
- The model may overfit the training data and perform poorly on new data.
Real-World Applications of Supervised Learning
Healthcare
Supervised learning is used to predict diseases, assist in medical diagnosis, and identify patients who may be at higher health risk.
Banking and Finance
Banks use supervised learning for credit scoring, fraud detection, and loan approval decisions.
Education
Educational institutions use it to predict student performance, analyze examination results, and identify students who may need additional support.
E-Commerce
Online businesses use supervised learning to recommend products and predict customer purchasing behavior.
Social Media
Social media platforms apply supervised learning for sentiment analysis, spam detection, and personalized content recommendations.
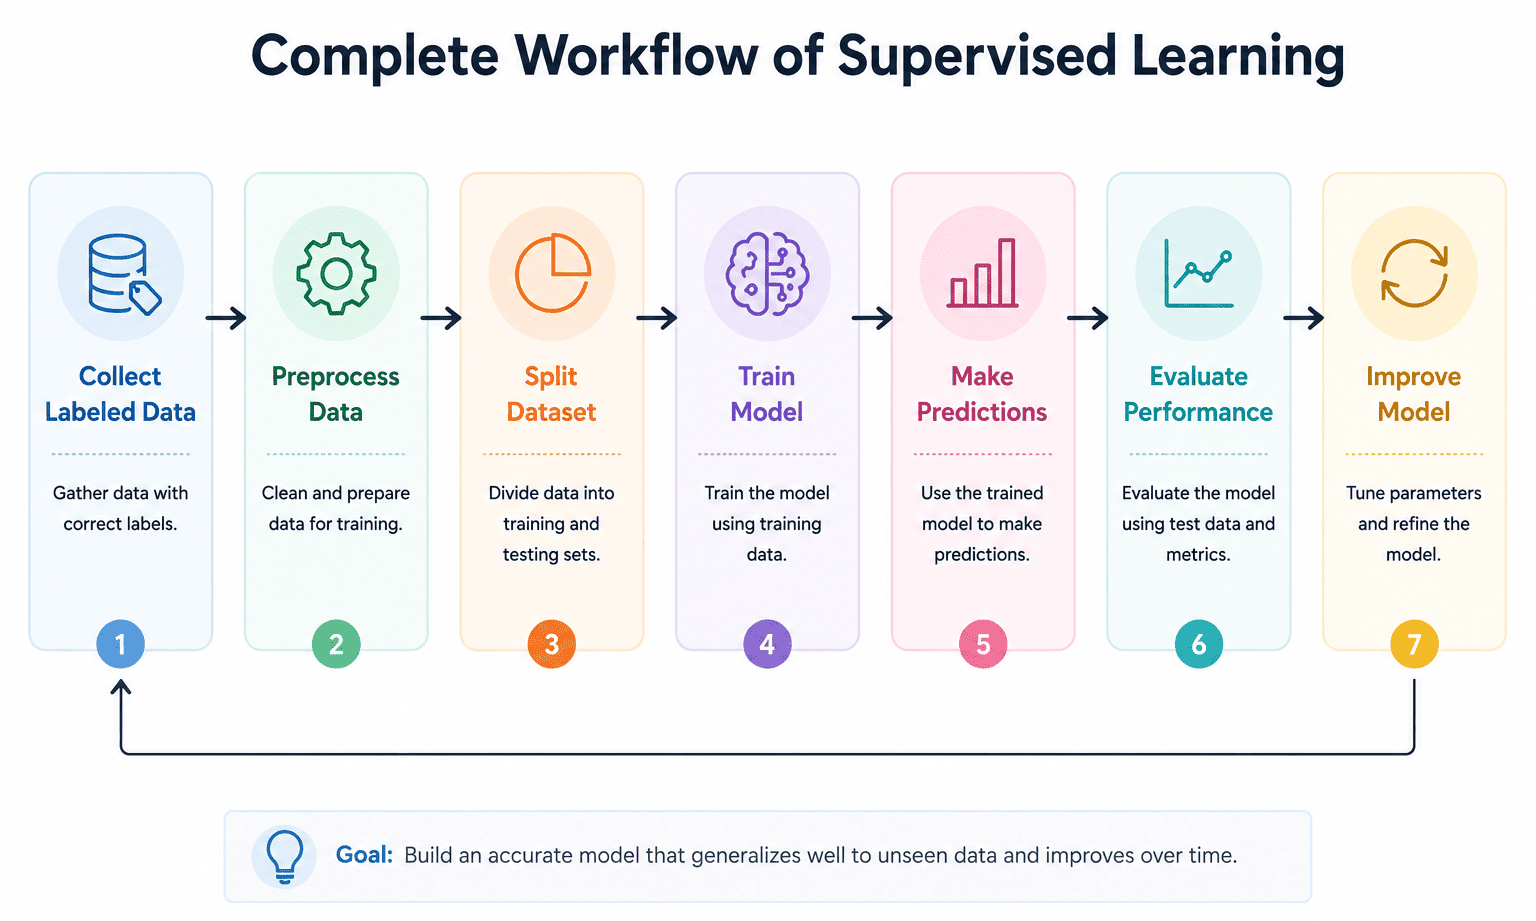
Workflow of Supervised Learning