Random Forest
Random Forest
Definition
Random Forest is a Supervised Machine Learning algorithm that combines the predictions of multiple Decision Trees to produce a more accurate and reliable result.
It is called a Random Forest because it consists of a collection (or forest) of Decision Trees, where each tree is built using randomly selected training samples and random subsets of features.
Instead of relying on a single Decision Tree, the Random Forest algorithm combines the predictions of many trees. This approach improves the overall accuracy of the model and reduces the chances of overfitting.
Random Forest can be used for both classification and regression problems.
Why is it Called Random Forest?
The name Random Forest is derived from two important concepts:
- Random: Each Decision Tree is trained using a random subset of the training data and a random subset of features.
- Forest: A large collection of Decision Trees working together to make a final prediction.
Since many trees work together, the model becomes more robust and produces better predictions than a single Decision Tree.
Why Random Forest?
Although Decision Trees are simple and easy to understand, they can easily overfit the training data. A very deep Decision Tree may learn the training data too well, resulting in poor performance on unseen data.
Random Forest overcomes this limitation by building multiple Decision Trees instead of just one. Each tree makes its own prediction, and the final prediction is obtained by combining the predictions of all the trees.
As a result, Random Forest usually provides better accuracy, higher stability, and improved generalization than a single Decision Tree.
Illustration
Single Decision Tree
        ↓
Can Overfit
        ↓
Poor Performance on New Data
Random Forest
(Many Decision Trees)
        ↓
Combine Predictions
        ↓
Better Accuracy and Generalization
Applications of Random Forest
Random Forest is widely used in many real-world applications because of its high accuracy and robustness.
Some common applications include:
- Fraud Detection
- Disease Prediction
- Customer Churn Prediction
- Loan Approval Systems
- House Price Prediction
- Credit Risk Analysis
- Stock Market Prediction
- Recommendation Systems
Note:
Random Forest builds multiple Decision Trees using random subsets of data and features. By combining the predictions of many trees, it reduces overfitting and produces more accurate and reliable results than a single Decision Tree.
This section should be simple and intuitive, especially since it is the student's first exposure to Random Forest. Here's a textbook-style version that naturally follows the Definition section.
Basic Working of Random Forest
Random Forest works by creating multiple Decision Trees instead of relying on a single tree. Each Decision Tree is trained using a random subset of the training data and a random subset of features. Every tree makes its own prediction independently.
For a classification problem, the predictions from all the trees are combined using majority voting. The class that receives the highest number of votes becomes the final prediction.
For a regression problem, the predictions of all the trees are averaged to obtain the final output.
Example
Consider the following training dataset.
| Study Hours | Attendance (%) | Result |
|---|---|---|
| 2 | 60 | Fail |
| 3 | 65 | Fail |
| 6 | 85 | Pass |
| 8 | 90 | Pass |
Suppose a Random Forest algorithm creates four Decision Trees.
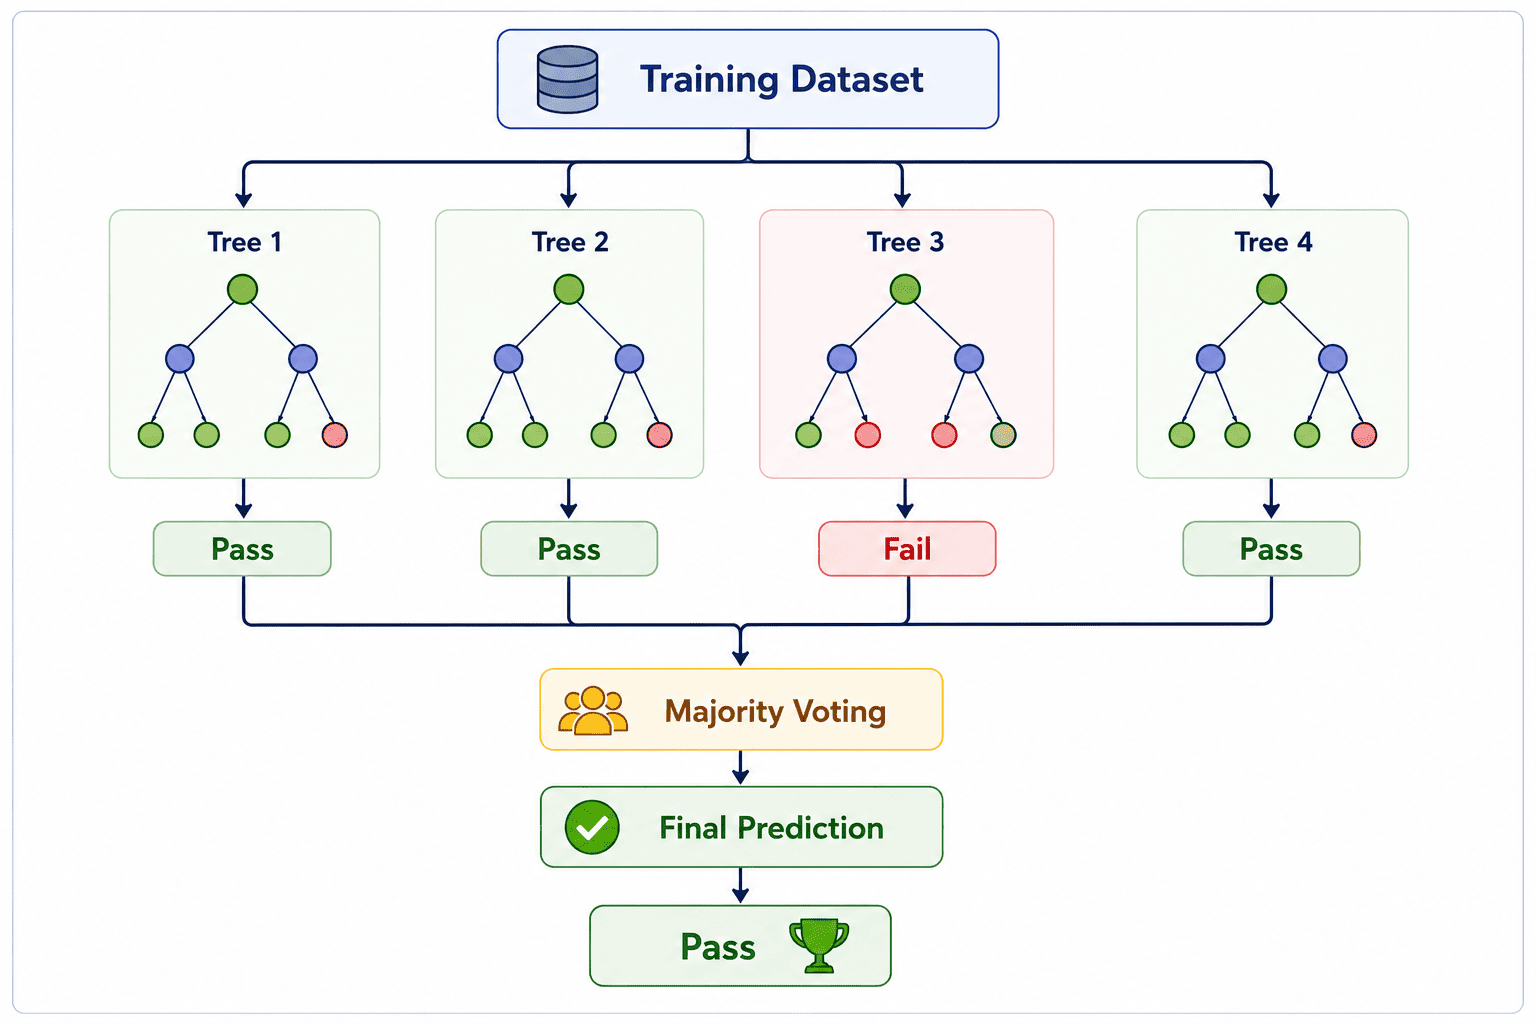
In this example, three Decision Trees predict Pass, while one Decision Tree predicts Fail. Since the majority of the trees predict Pass, the Random Forest also predicts Pass as the final result.
This process makes the model more reliable because the final prediction is based on the combined opinion of multiple Decision Trees rather than a single tree.
Key Points
- Random Forest builds multiple Decision Trees.
- Each tree is trained using randomly selected data and features.
- Every tree makes its own prediction independently.
- For classification, the final prediction is obtained using majority voting.
- For regression, the final prediction is obtained by taking the average of all predictions.
- Combining the predictions of many trees improves accuracy and reduces overfitting.
This section can be made much smoother and more like a textbook. I would avoid short bullet points and instead explain each step in a paragraph followed by a simple example.
Working of Random Forest
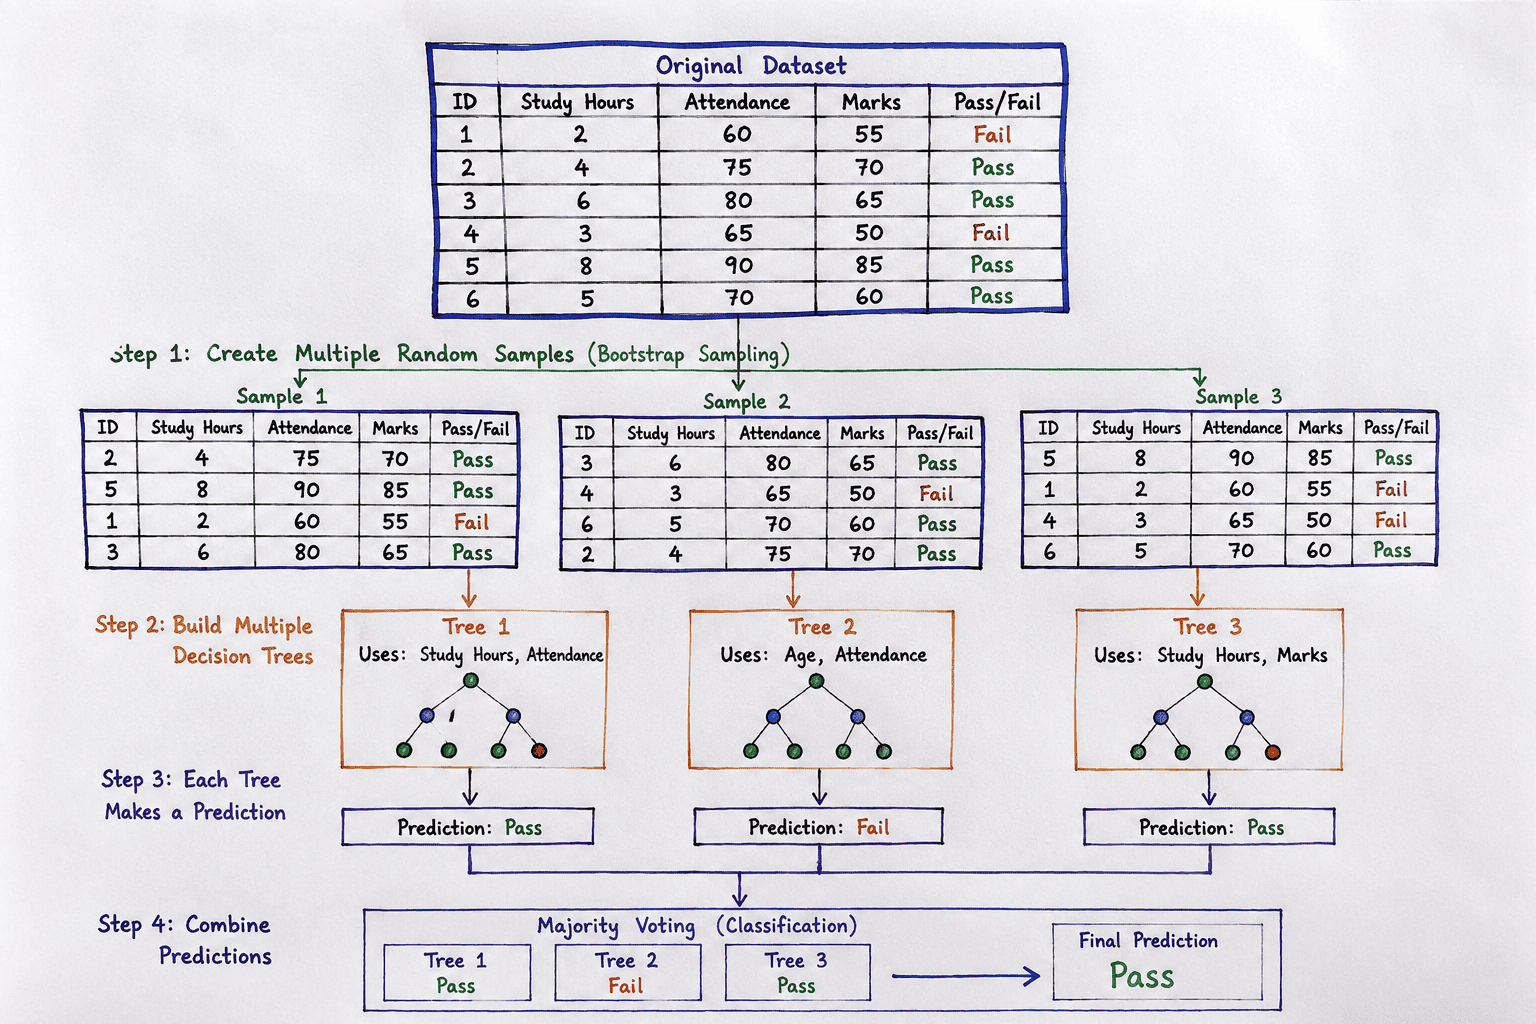
The Random Forest algorithm builds multiple Decision Trees instead of a single tree. Each tree is trained on different data and makes its own prediction. Finally, the predictions from all the trees are combined to produce the final result. The complete working of a Random Forest can be understood in the following steps.
Step 1: Create Multiple Random Samples
The first step in building a Random Forest is to create multiple training datasets from the original dataset. These datasets are generated using a technique called Bootstrap Sampling.
In Bootstrap Sampling, records are selected randomly from the original dataset to create several new datasets. Each sample is used to train a different Decision Tree. Since every tree receives a different dataset, each tree learns slightly different patterns.
Example
Suppose the original dataset contains the following records.
| Original Dataset |
|---|
| A |
| B |
| C |
| D |
| E |
| F |
Using Bootstrap Sampling, the Random Forest creates multiple random samples.
| Sample 1 | Sample 2 | Sample 3 |
|---|---|---|
| A | B | A |
| C | C | B |
| D | E | D |
| F | F | E |
These samples are then used to train different Decision Trees.
Step 2: Build Multiple Decision Trees
After creating the random samples, the Random Forest builds multiple Decision Trees.
Each Decision Tree is trained using:
- A different random sample of the training data.
- A different random subset of input features.
Since every tree receives different data and features, the trees become different from one another. This diversity helps improve the overall performance of the model.
Example
| Decision Tree | Features Used |
|---|---|
| Tree 1 | Study Hours, Attendance |
| Tree 2 | Age, Attendance |
| Tree 3 | Study Hours, Marks |
Although all trees solve the same problem, they use different information to make predictions.
Step 3: Train Each Decision Tree Independently
Each Decision Tree is trained independently using its own dataset and selected features.
During training, every tree learns its own decision rules based on the data it receives. Therefore, different trees may generate different decision rules for the same problem.
Example
Tree 1
Study Hours > 5
        ↓
      Pass
Tree 2
Attendance > 70%
         ↓
       Pass
Tree 3
Marks > 60
      ↓
    Pass
Each tree makes its prediction without considering the predictions of the other trees.
Step 4: Combine the Predictions
Once all the Decision Trees have made their predictions, the Random Forest combines these predictions to produce the final result.
The method used to combine the predictions depends on the type of machine learning problem.
Classification Problems
For classification, the Random Forest uses Majority Voting. The class predicted by the majority of the trees becomes the final prediction.
Example
| Decision Tree | Prediction |
|---|---|
| Tree 1 | Pass |
| Tree 2 | Pass |
| Tree 3 | Fail |
| Tree 4 | Pass |
| Tree 5 | Pass |
Since Pass receives the highest number of votes, the final prediction is:
Final Prediction = Pass
Regression Problems
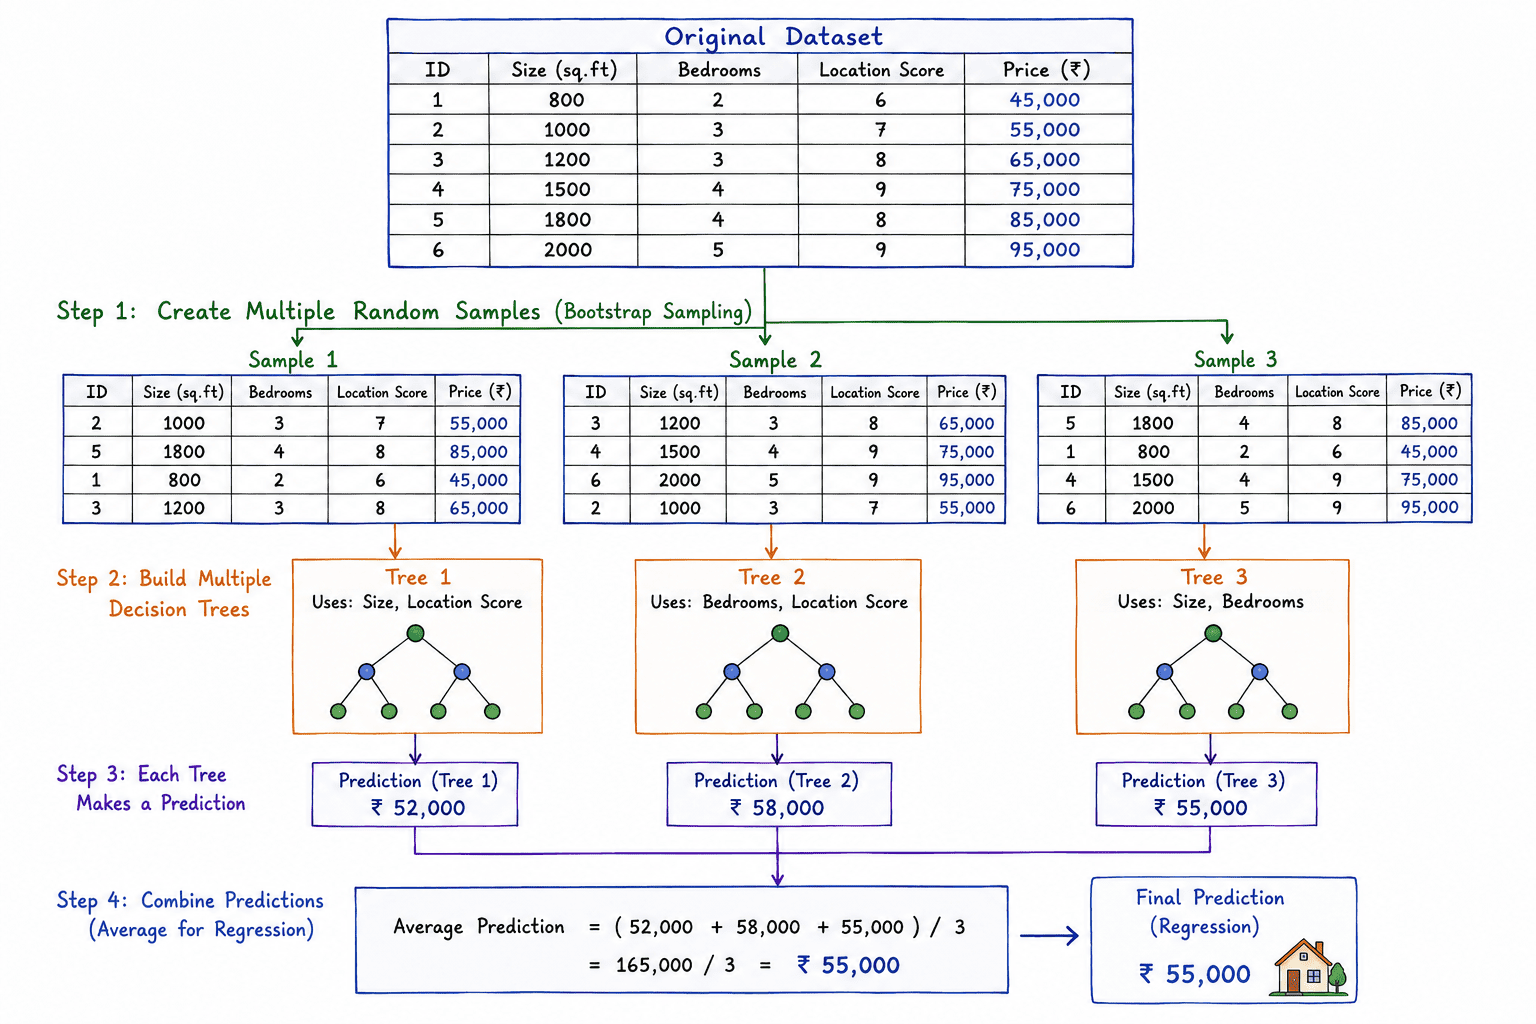
For regression, the Random Forest calculates the average of the predictions made by all the Decision Trees.
Example
| Decision Tree | Prediction |
|---|---|
| Tree 1 | 50,000 |
| Tree 2 | 55,000 |
| Tree 3 | 52,000 |
The final prediction is calculated as:
\[\frac{50000 + 55000 + 52000}{3}=\frac{157000}{3}=52333.33\]
Final Prediction = 52,333
Procedure of the Working of Random Forest
The complete working of the Random Forest algorithm can be summarized as follows:
- Create multiple random samples from the original dataset using Bootstrap Sampling.
- Build multiple Decision Trees using different datasets and random subsets of features.
- Train each Decision Tree independently.
- Collect the predictions from all the trees.
- Use Majority Voting for classification or Average Prediction for regression to obtain the final result.
Since many Decision Trees work together, Random Forest generally produces more accurate, stable, and reliable predictions than a single Decision Tree while significantly reducing the risk of overfitting.
| Sample 1 | Sample 2 | Sample 3 |
|---|---|---|
| A | B | A |
| C | C | B |
| D | E | D |
| F | F | E |
Why Does Random Forest Perform Better?
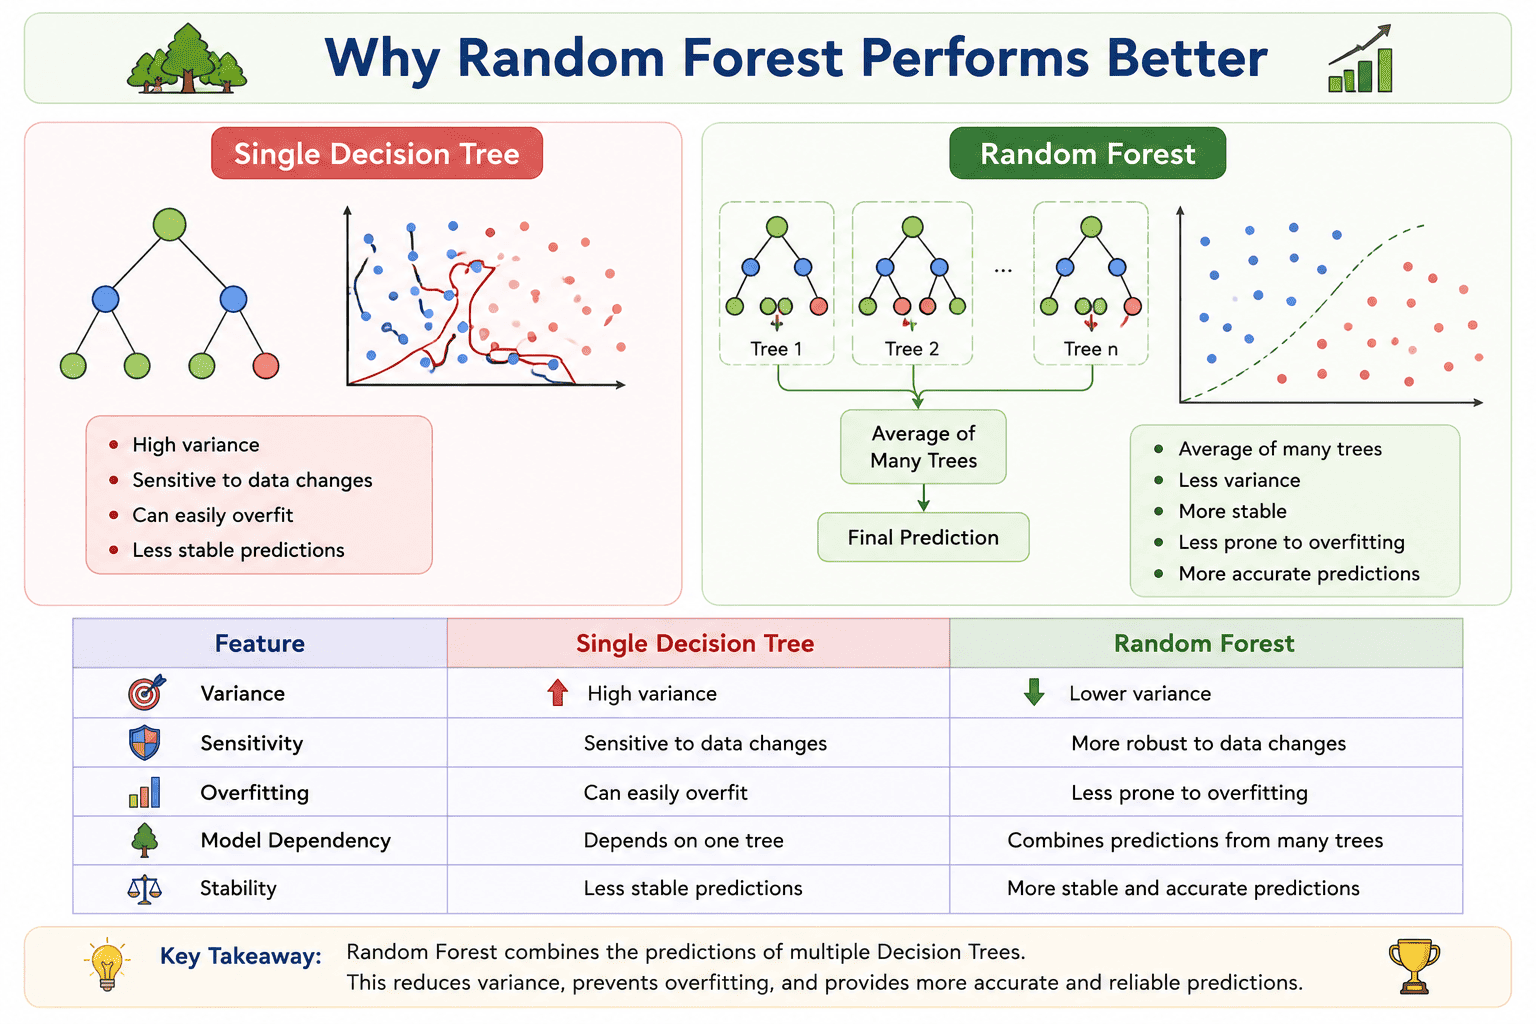
A single Decision Tree makes predictions based on one model. Although it can learn the training data very well, it is often sensitive to small changes in the dataset. As a result, a single tree may produce different predictions for slightly different training data and is more likely to overfit.
Random Forest overcomes this limitation by building multiple Decision Trees using different random samples of the data and different subsets of features. Instead of relying on the prediction of a single tree, it combines the predictions of all the trees.
Since the errors made by individual trees tend to cancel each other out, the final prediction becomes more accurate, more stable, and less affected by variations in the training data. This reduction in variance is the primary reason why Random Forest generally performs better than a single Decision Tree.
Comparison
| Single Decision Tree | Random Forest |
|---|---|
| High variance | Lower variance |
| Sensitive to data changes | More robust to data changes |
| Can easily overfit | Less prone to overfitting |
| Depends on one tree | Combines predictions from many trees |
| Less stable predictions | More stable and accurate predictions |
Note: Random Forest improves prediction accuracy by combining the outputs of multiple Decision Trees, resulting in lower variance, reduced overfitting, and better generalization to unseen data.
This topic should naturally follow the Working of Random Forest section because these are the two key ideas that make Random Forest different from a single Decision Tree.
Important Concepts in Random Forest
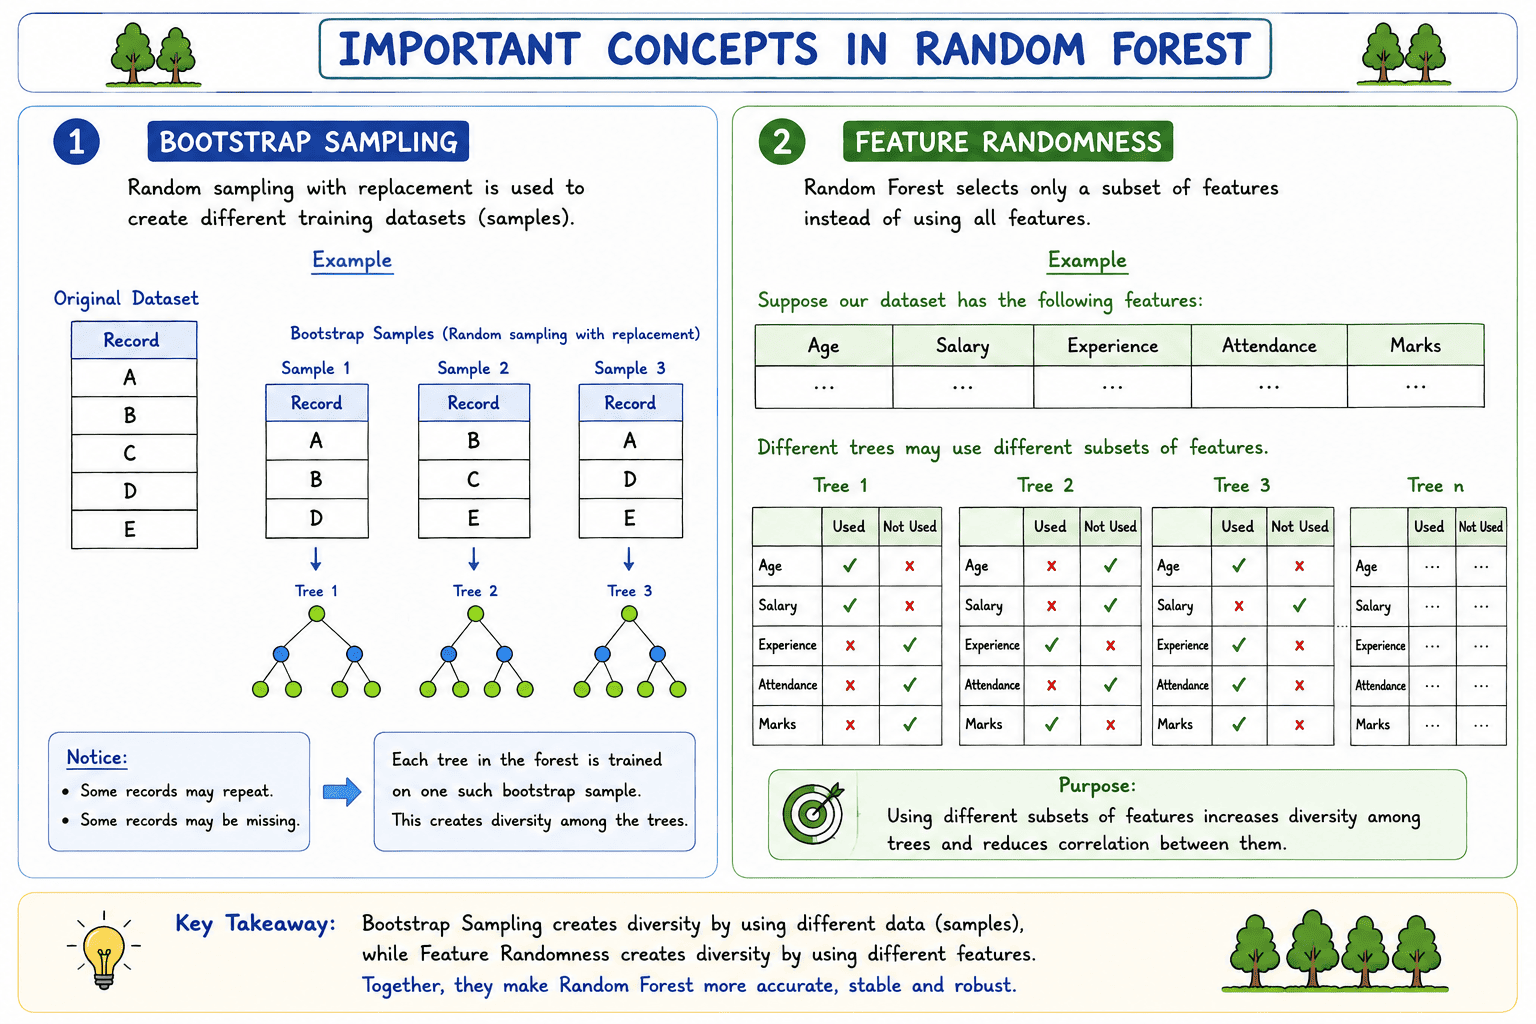
Random Forest performs well because it introduces randomness while building Decision Trees. Two important concepts make this possible: Bootstrap Sampling and Feature Randomness. Together, these techniques create diverse Decision Trees that improve the accuracy and stability of the model.
1. Bootstrap Sampling
Bootstrap Sampling is a technique in which multiple training datasets are created by randomly selecting records from the original dataset with replacement.
The phrase with replacement means that after a record is selected, it is placed back into the dataset before the next selection. As a result, the same record can be selected more than once, while some records may not be selected at all.
Example
Suppose the original dataset contains the following records.
Original Dataset
A B C D E
One possible bootstrap sample is
A B B D E
In this sample:
- B appears twice because sampling is done with replacement.
- C is not selected in this sample.
Every Decision Tree is trained using a different bootstrap sample, allowing each tree to learn slightly different patterns from the data.
2. Feature Randomness
In addition to using different training samples, Random Forest also introduces randomness by selecting only a subset of features while building each Decision Tree.
Instead of considering all the available features at every split, each tree uses only a randomly selected subset of features. This ensures that different trees learn different decision rules.
Example
Suppose a dataset contains the following features.
Age
Salary
Experience
Attendance
Marks
One Decision Tree may use
Age
Salary
Another Decision Tree may use
Experience
Marks
Since different trees use different combinations of features, the trees become more diverse and make different predictions.
Purpose of Feature Randomness
The main objective of feature randomness is to increase the diversity among Decision Trees. When many diverse trees are combined, the Random Forest produces more accurate, stable, and reliable predictions while reducing the risk of overfitting.
Note: Bootstrap Sampling creates diversity by using different training records, whereas Feature Randomnesscreates diversity by using different subsets of features. Together, these two concepts make Random Forest more robust and accurate than a single Decision Tree.
Since your readers have already studied Decision Tree Hyperparameters, this section should emphasize that Random Forest also has hyperparameters, with the addition of n_estimators, which is unique to Random Forest.
Hyperparameters in Random Forest
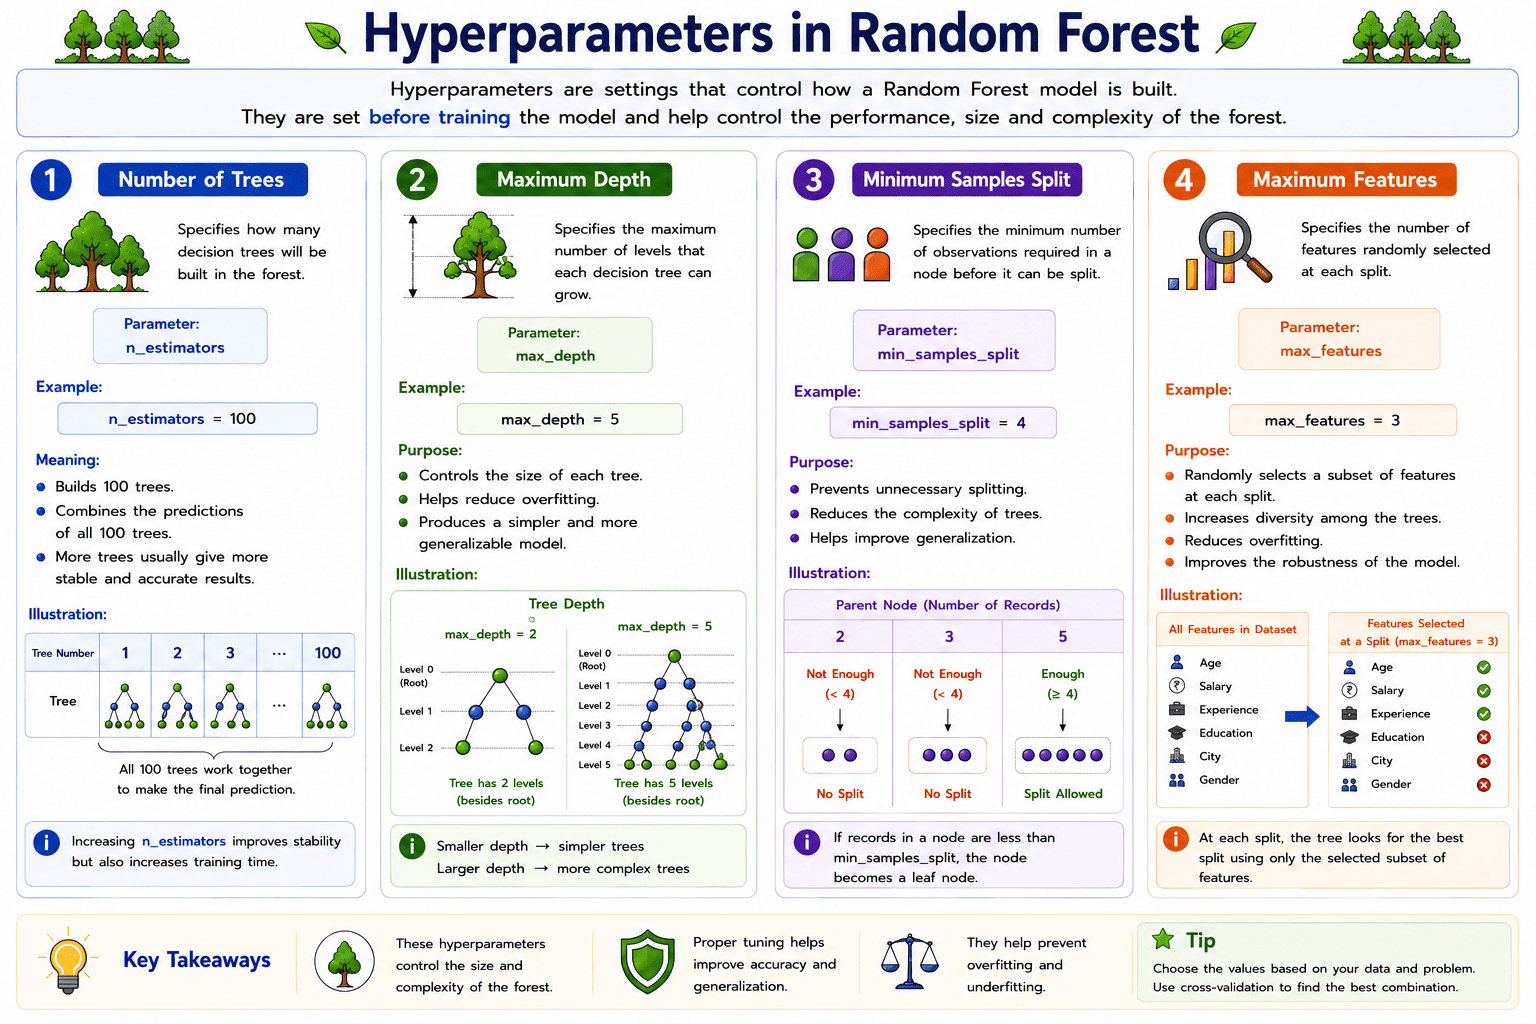
A hyperparameter is a setting that controls how a Random Forest model is built. These values are specified before training the model and help determine the size, complexity, and performance of the forest. Selecting appropriate hyperparameter values improves prediction accuracy and helps the model generalize better to new data.
The following are some of the most commonly used hyperparameters in Random Forest.
1. Number of Trees (n_estimators)
The number of trees specifies how many Decision Trees will be created in the Random Forest.
In general, increasing the number of trees improves the stability and accuracy of the model. However, using a very large number of trees also increases the training time.
Example:
n_estimators = 100
Meaning:
- Builds 100 Decision Trees.
- Combines the predictions of all 100 trees.
- More trees usually produce more reliable predictions.
2. Maximum Depth (max_depth)
The maximum depth specifies the maximum number of levels that each Decision Tree in the Random Forest is allowed to grow.
Limiting the depth helps prevent individual trees from becoming too complex and reduces the risk of overfitting.
Example:
max_depth = 8
Purpose:
- Controls the size of each tree.
- Helps reduce overfitting.
- Produces a simpler and more generalizable model.
3. Minimum Samples Split (min_samples_split)
The minimum samples split specifies the minimum number of observations required before a node can be divided into two child nodes.
If a node contains fewer records than this value, it is not split further.
Example:
min_samples_split = 4
Purpose:
- Prevents unnecessary splitting.
- Reduces the complexity of the trees.
- Helps improve generalization.
4. Maximum Features (max_features)
The maximum features parameter specifies the maximum number of input features that are randomly selected while searching for the best split at each node.
Instead of considering all the available features, only a subset is evaluated. This increases diversity among the Decision Trees and improves the overall performance of the Random Forest.
Example:
max_features = 3
Purpose:
- Randomly selects a subset of features at each split.
- Increases diversity among the trees.
- Reduces overfitting.
- Improves the robustness of the model.
Note:The performance of a Random Forest depends on choosing appropriate hyperparameter values. Proper tuning of parameters such as n_estimators, max_depth, min_samples_split, and max_features helps produce a more accurate, stable, and reliable model.
Feature Importance
One of the major advantages of Random Forest is that it can identify which input features are most important for making predictions. This helps us understand which variables have the greatest influence on the output.
While building the Decision Trees, the Random Forest algorithm repeatedly chooses the best feature to split the data at each node. Features that consistently produce better splits and improve the model's predictions are considered more important.
After all the Decision Trees are built, Random Forest combines the contribution of each feature across all the trees and assigns an importance score to every feature. A higher score indicates that the feature contributes more to the model's predictions.
Example
| Feature | Importance Score |
|---|---|
| Study Hours | 0.45 |
| Attendance | 0.30 |
| Age | 0.15 |
| Gender | 0.10 |
From the above table, Study Hours has the highest importance score (0.45). This means it contributes the most to the model's predictions. Attendance is the second most important feature, while Age and Gender have comparatively smaller contributions.
How Does Random Forest Calculate Feature Importance?
The process can be summarized in four simple steps:
- Build multiple Decision Trees.
- At each split, select the feature that best separates the data.
- Measure how much each selected feature improves the quality of the split.
- Combine these improvements across all the trees to calculate the final importance score for each feature.
Features that improve the splits more frequently and by a larger amount receive higher importance scores.
Note: Feature Importance helps identify the most influential variables in a dataset. It is widely used for feature selection, model interpretation, and understanding which factors have the greatest impact on the prediction.
Advantages
- High accuracy
- Reduces overfitting compared to Decision Tree
- Handles missing values reasonably well
- Works for classification and regression
- Handles large datasets effectively
- Provides feature importance
Disadvantages
- Slower than Decision Tree
- Requires more memory
- Less interpretable than a single Decision Tree
- Large forests can become computationally expensive